Getting Started
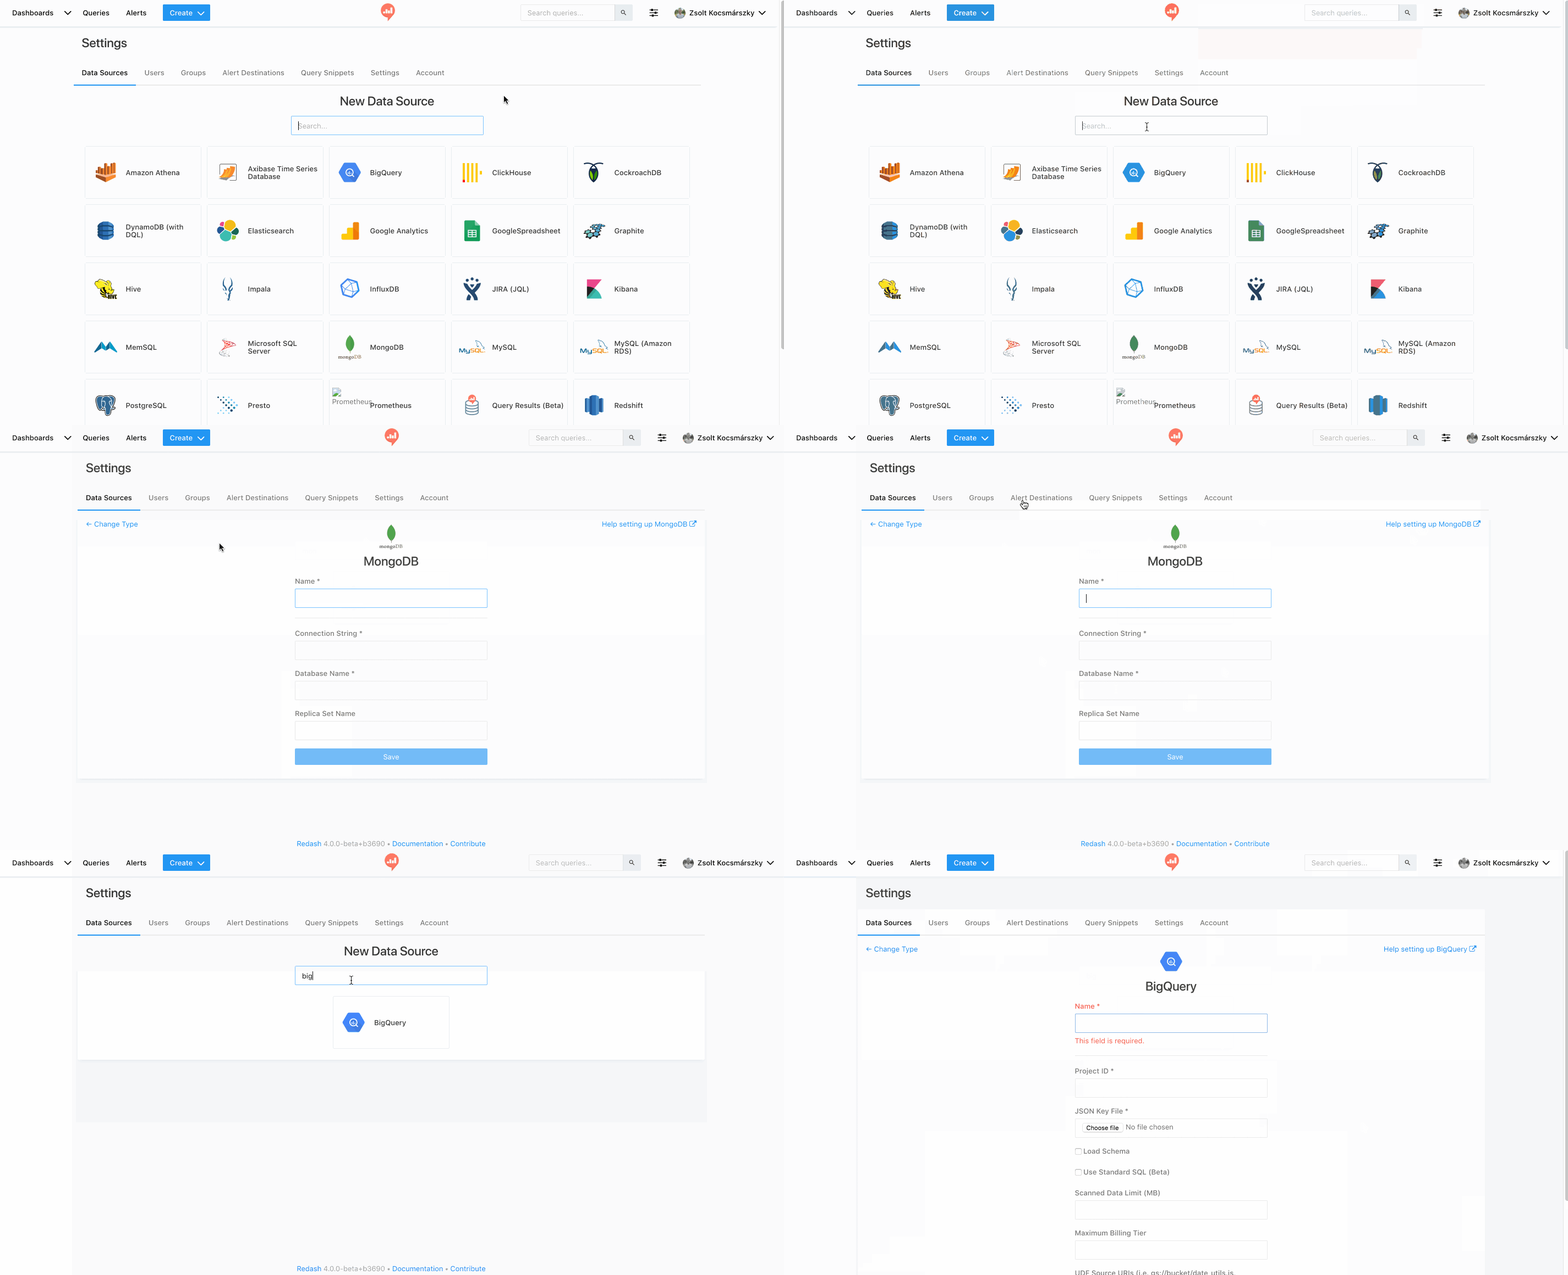
1. Add A Data Source
The first thing you’ll want to do is connect a data source (see supported data sources). You can open the Data Sources management page by clicking the Settings icon:
![]()
52.71.84.157 in your database firewall/Security Groups.
2. Write A Query
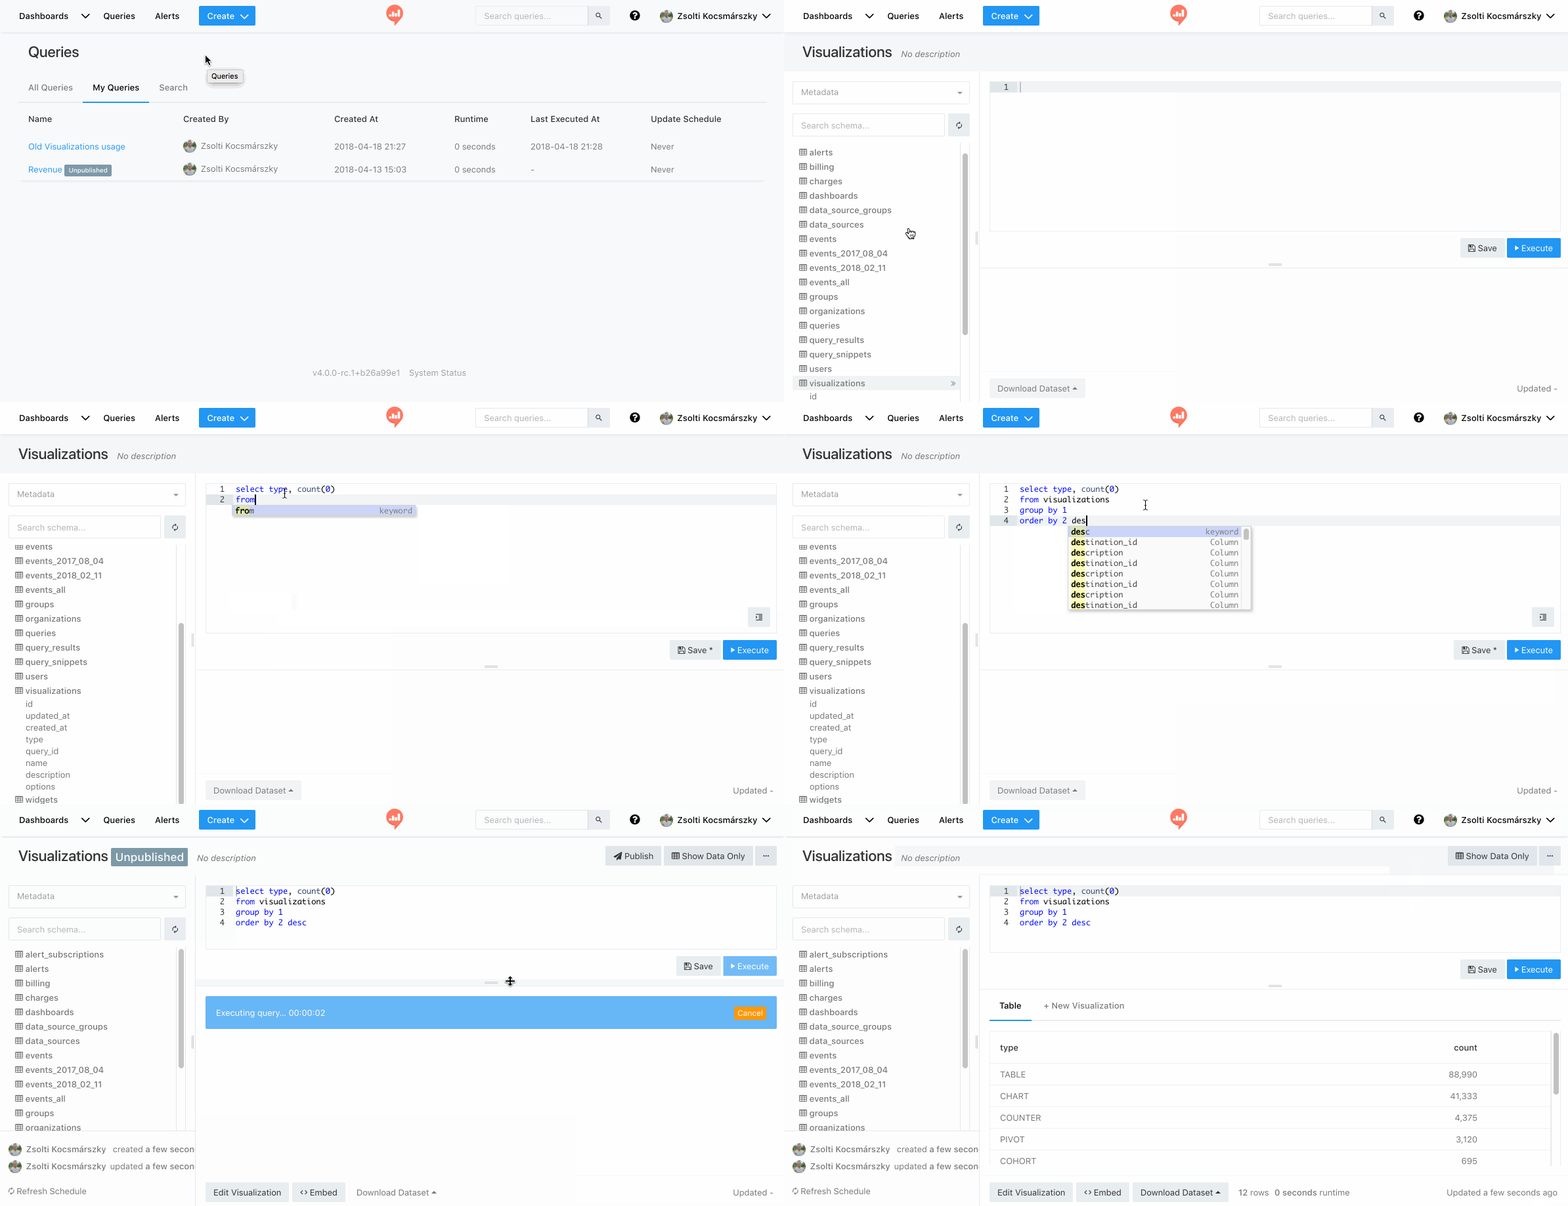
Once you’ve connected a data source, it’s time to write a query: click on “Create” in the navigation bar, and then choose “Query”. See the “Writing Queries” page for detailed instructions on how to write queries.
3. Add Visualizations
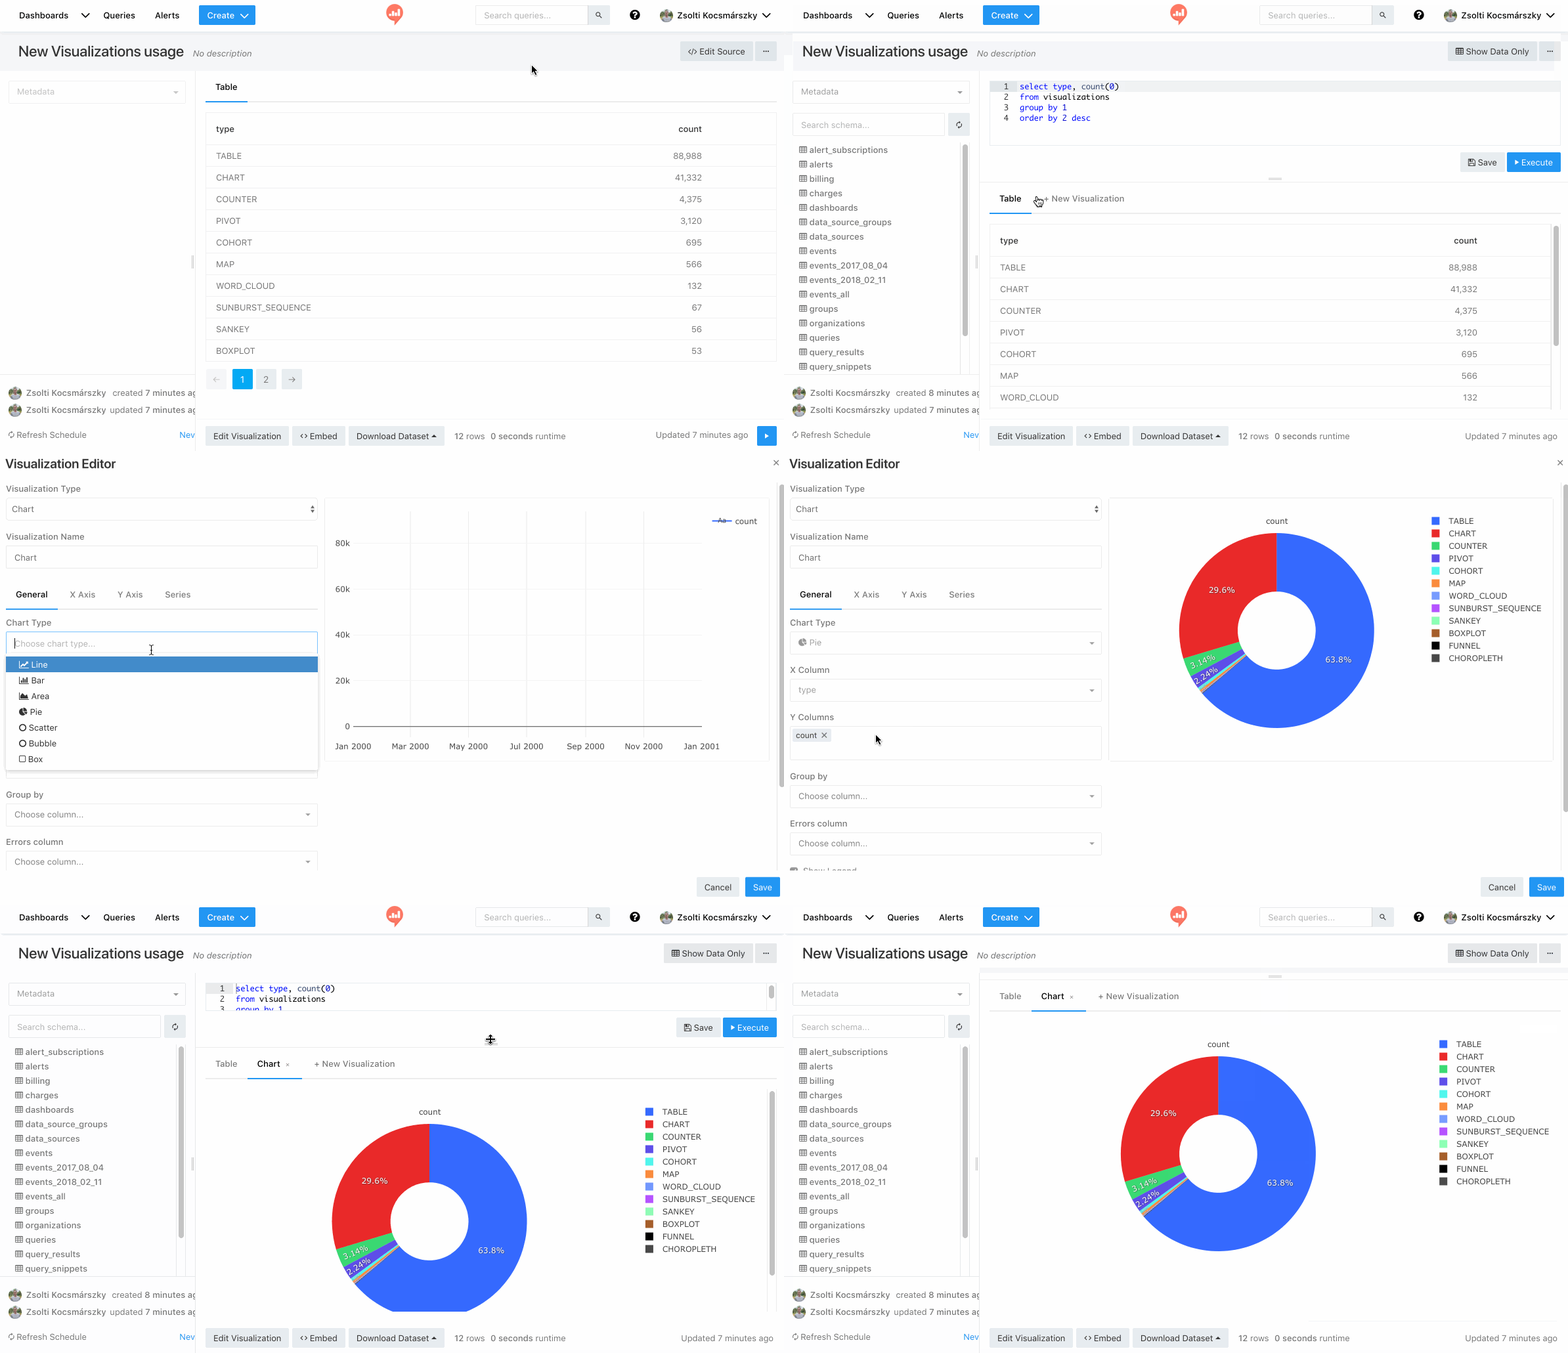
By default, your query results (data) will appear in a simple table. Visualizations are much better to help you digest complex information, so let’s visualize your data. Redash supports multiple types of visualizations so you should find one that suits your needs.
Click the “New Visualization” button just above the results to select the perfect visualization for your needs. You can view more detailed instructions here.
4. Create A Dashboard
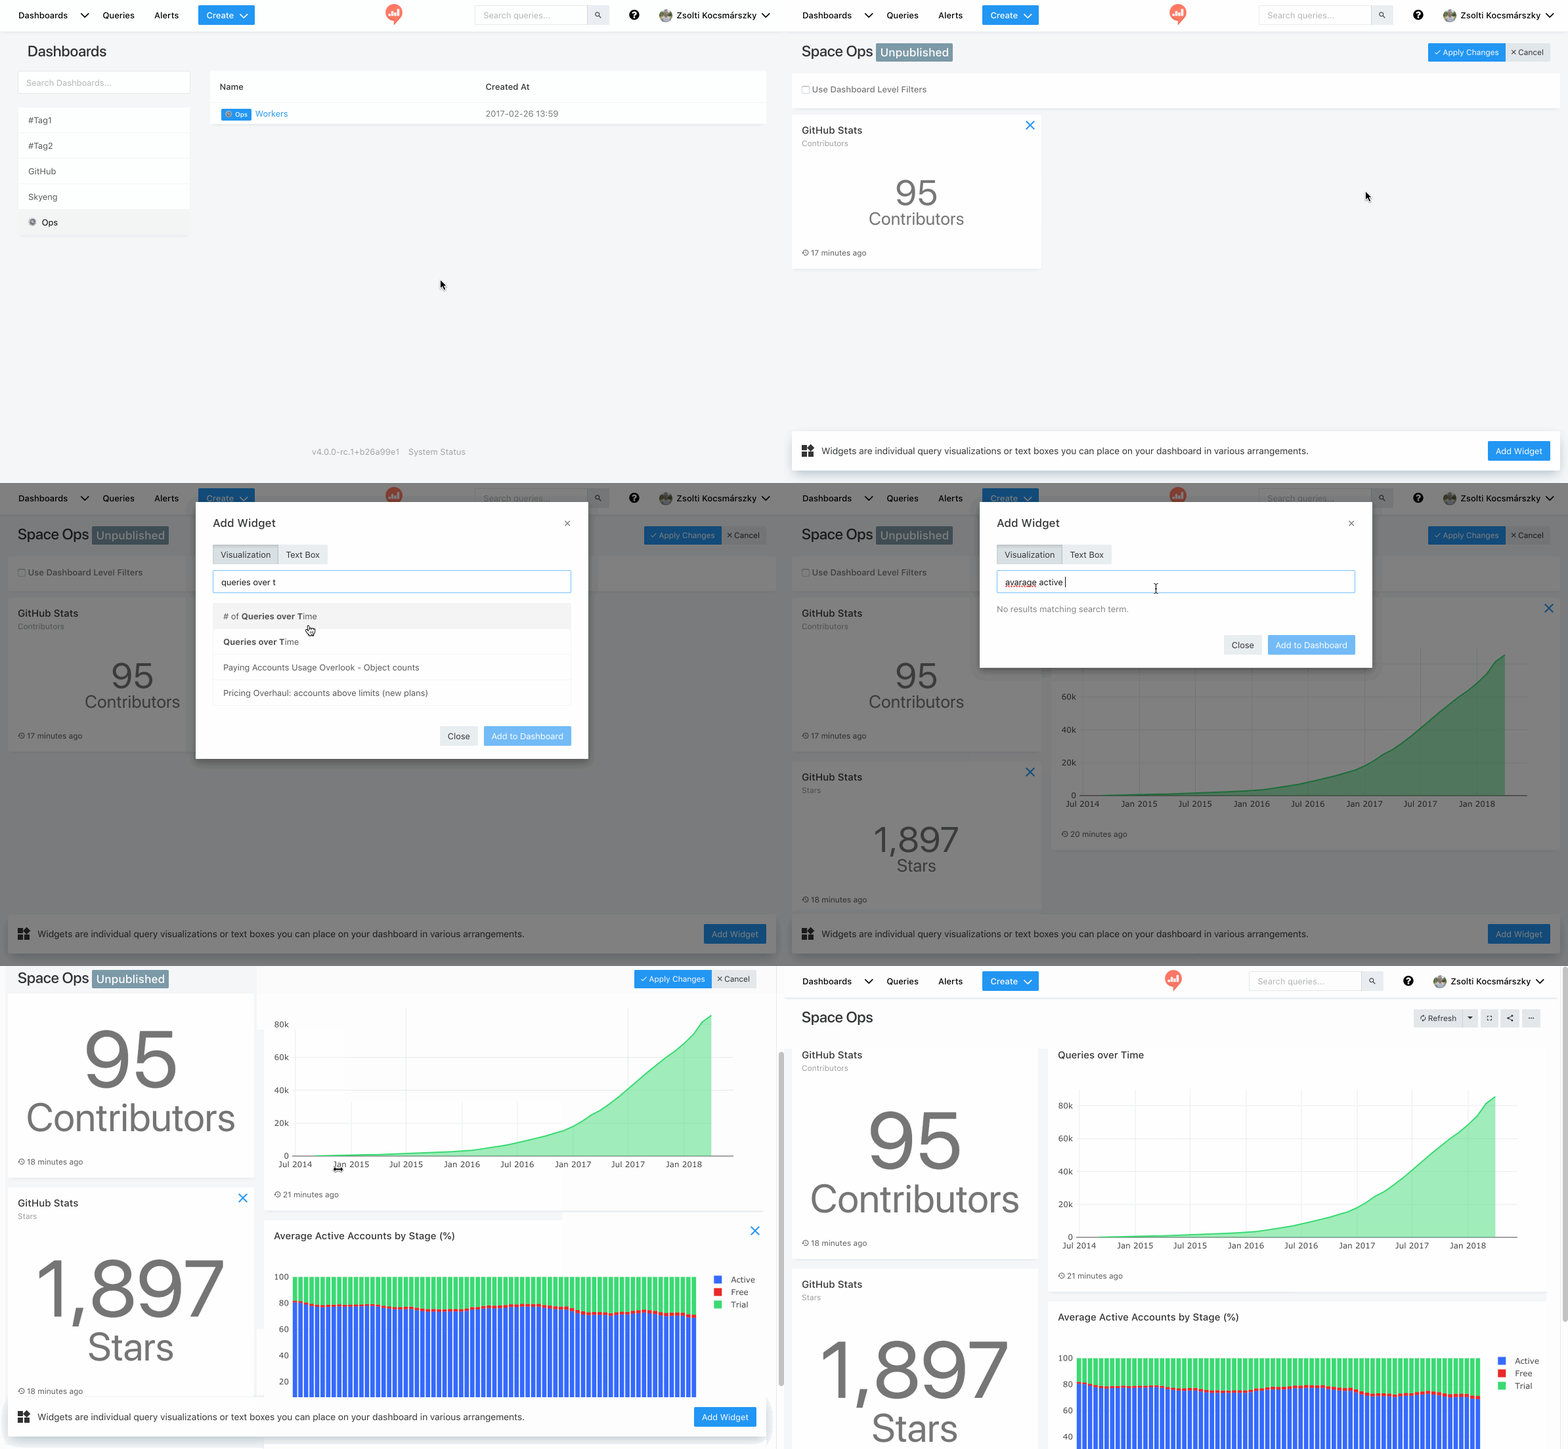
You can combine visualizations and text into thematic & powerful dashboards. Add a new dashboard by clicking on “Create” in the navigation bar, and then choose “Dashboard”. Dashboards are visible for your team members or they can be shared publicly. For more details, click here.
5. Invite Colleagues
Redash is better together.
Admins, to start enjoying the collaborative nature of Redash you’ll want to invite your team!
Users can view team member’s queries for inspiration (or debugging 😉), fork them to create similar queries of their own, view & create dashboards, and share insights with others via Email, Slack, Mattermost or HipChat.
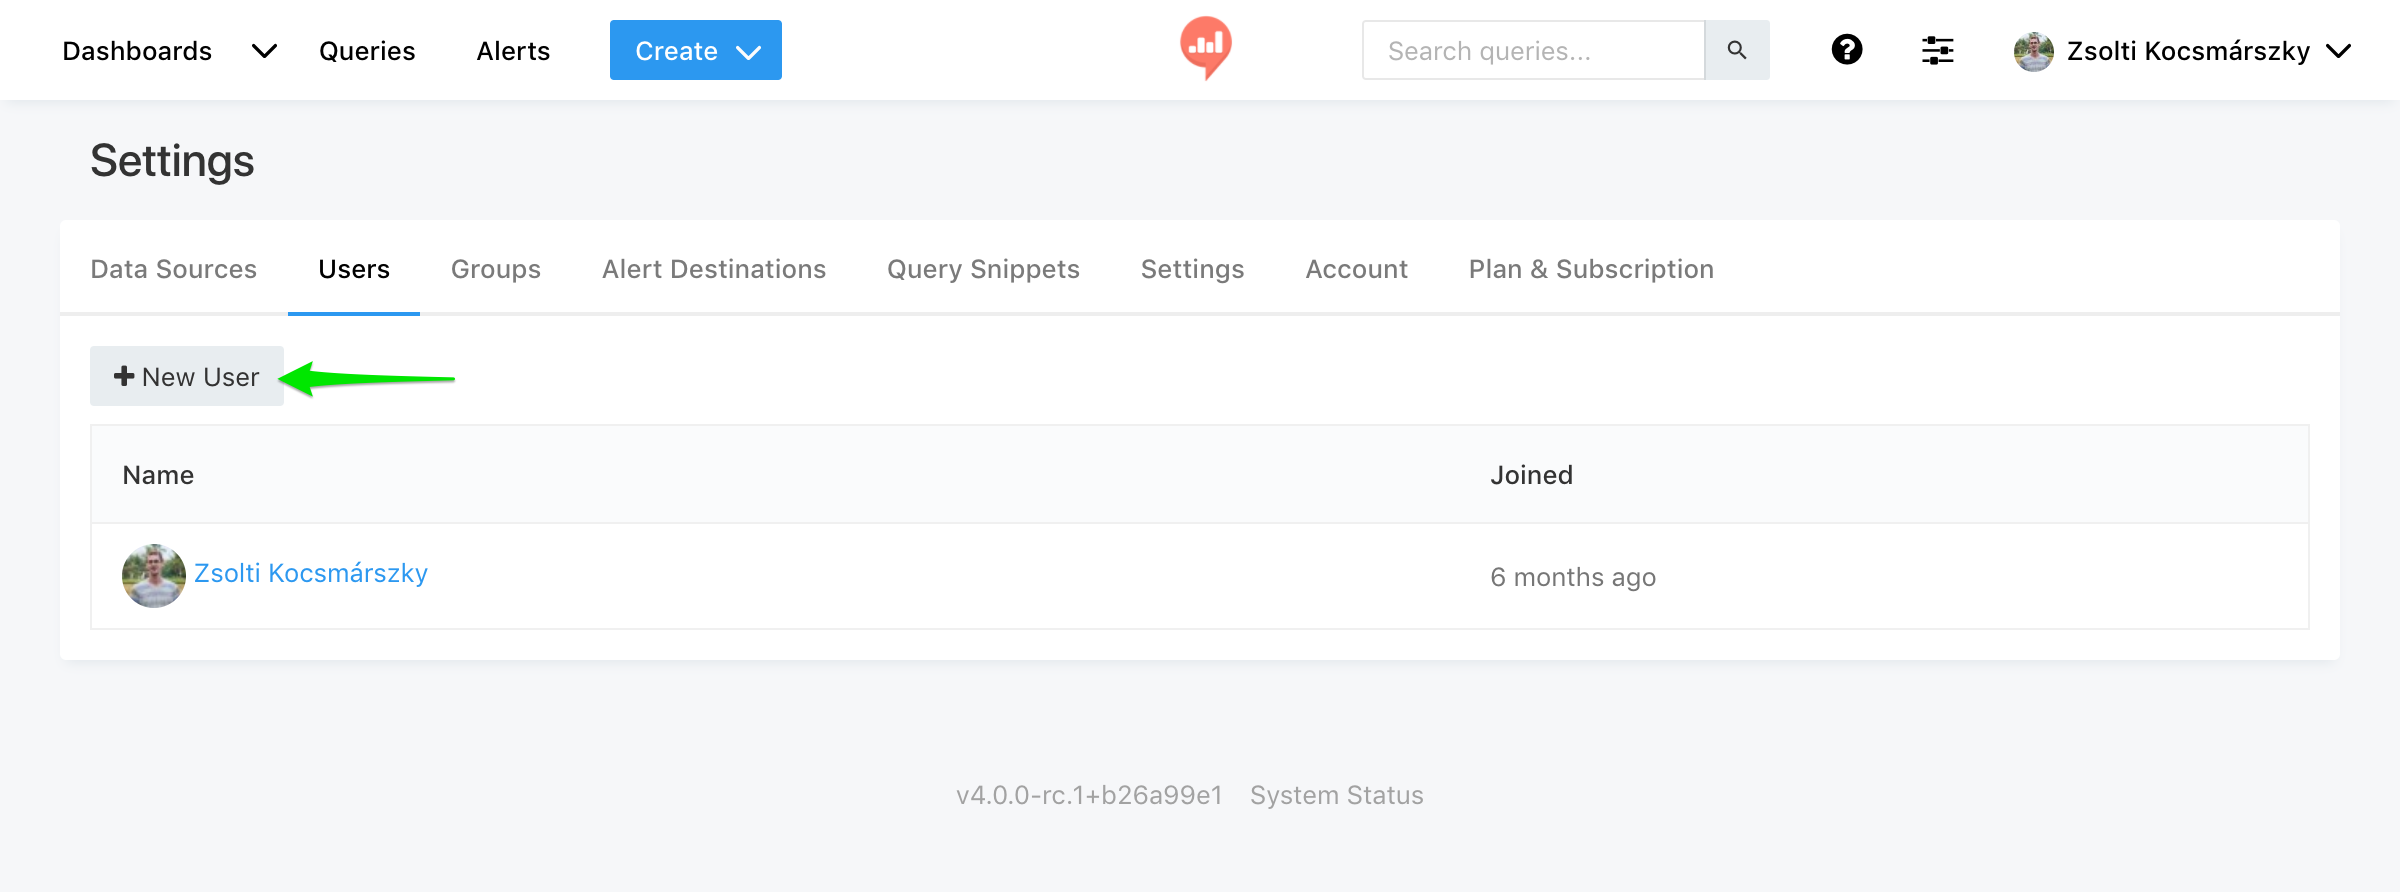
Users can only be invited by admins - to invite a new user go to Settings>Users and hit New User:
Then, fill in their name and email. They’ll get an invite via email and be required to set up a Redash account.
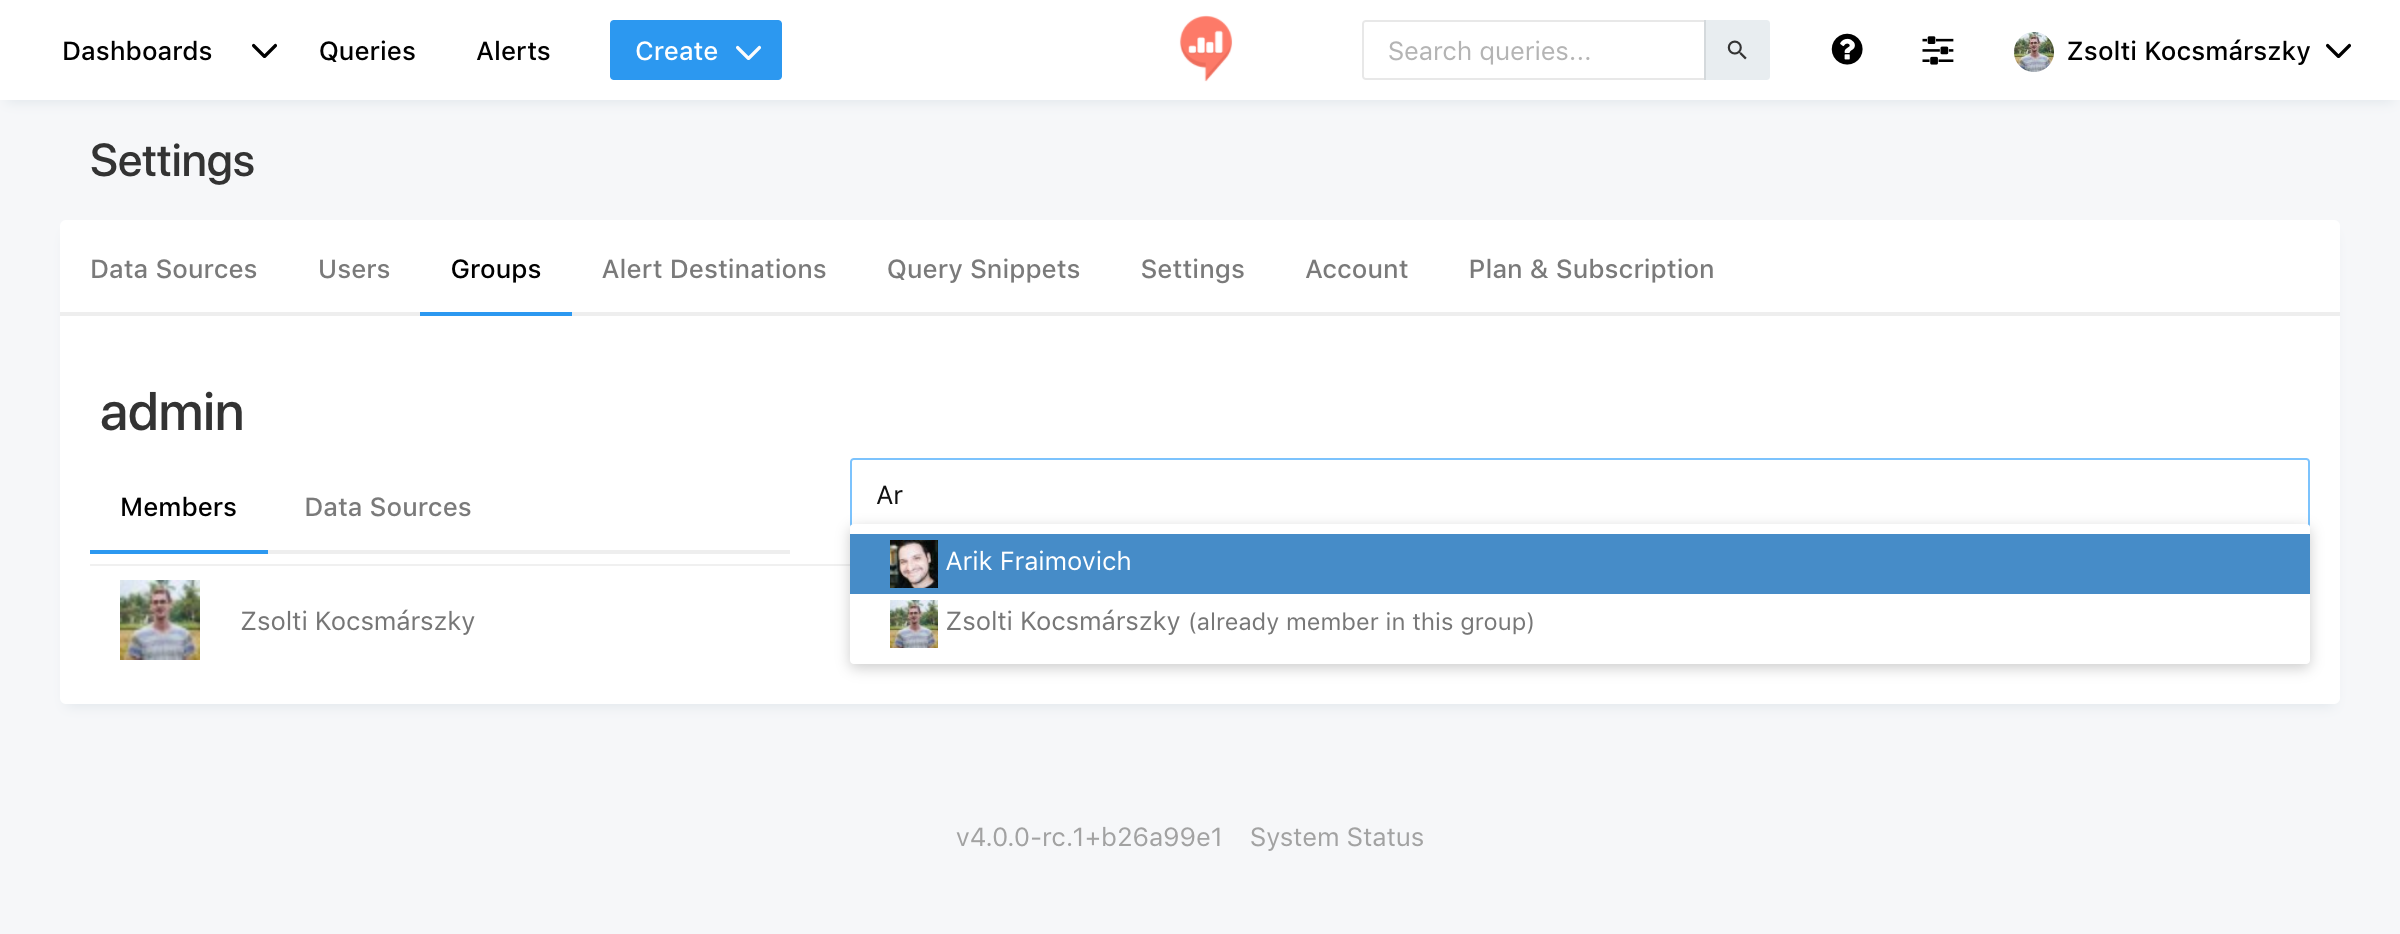
To add a user to an existing group, go to Setting>Groups, select the group and add users by typing their name:
